The Titanic dataset on Kaggle is the "fizzbuzz" of data science - everyone, at one point or another, will try their hand at what is a deceptively simple classification problem.

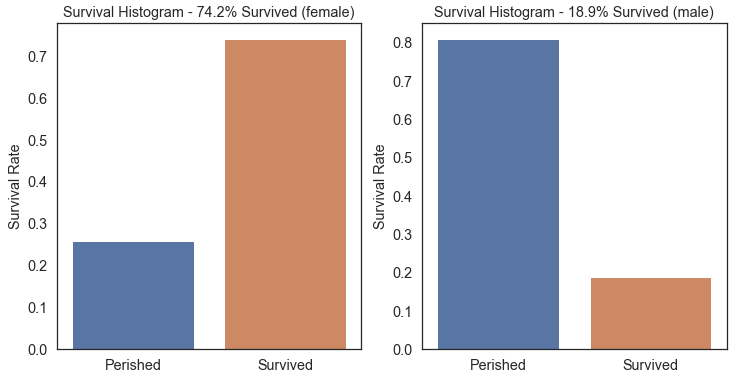
Before jumping into the modeling, I wanted to produce a standalone EDA notebook showcasing various techniques for visualization. In this project, I use Matplotlib and Seaborn to display various visuals, including: density plots, histograms and correlation heatmaps. I also explore the notion of conditional probability, i.e. the probability of survival given that a passenger was male vs. female. My hope is that this notebook can be used by other beginners on the Kaggle platform to better understand the Kaggle dataset.
Let me know what you think by leaving a comment on the notebook!